Motivation
This is probably the most abstruse title I have ever written. What I mean is simple. When a college decides to admit students, or when an employer decides to recruit people, they will have to rely on some signal. For example, in college admission, the SAT, in business school admission, the GMAT. Through these scores, they hope to have a better understanding of the underlying Ability of the applicant. However, in many cases, the tests are not challenging enough. For example, many of us probably won't find the SAT math section tough, we can easily answer all the questions right, if we do not make careless mistakes. Mistakes we make, if any, are due to carelessness or exhaustion, not our inability to answer them. This happens when our ability is beyond what the test is aimed to test. Formally, if we can measure ability and denote it as a random variable T, then the test score could be modeled as\[
Y_i=min(T, \text{cutoff})+\epsilon_i
\]
when our ability increase beyond the cutoff, it no longer helps us perform well on the tests. We generally think there is diminishing marginal returns on ability in terms of score on a test. This cutoff assumption is just an extreme version of diminishing marginal returns. The $\epsilon$ correspond to the factors unrelated to ability, like how one feels on the test day, carefulness, or random luck.
Now many "elite universities" want to be selective and only admit the best and brightest. Logically, they choose students in the highest percentile in terms of test score. What is interesting is among the students they select, how many of them are truly that good.
As a person who cannot tolerate non-quantifiable claims, I decide to do a numerical simulation.
Model Details
Suppose the elite university is interested in selecting the top 1% of the population. Suppose further that the university just admit the students with score in the top 1%.Now we need to specify the data generating process.Suppose both ability and error term comes from a normal distribution
\[
T_i \sim N(0,\sigma^2)\;\; \epsilon_i \sim N(0,1)
\]
The $\sigma$ will determine the relative weight of ability and error in determining the test score. Let us say $\sigma^2=10^2$.
Let us say once your ability is 1 standard deviation above average, the test does not reflect further increases in ability.
Results
So the elite university will admit a bunch of kids, all of which has score in the top 1%. But among them, how many of them has ability that is in the top 1%? about 5.7% from a numerical simulation with $10^6$ draws. Not so impressive. In fact, conditional on being admitted, we can plot the percentile of the students' ability within the general population.
Alternatively, consider a school that only admits students with score falling between 90% to 91%. Among those students 5.2% of them rank higher than 1% in terms of ability. In fact, if we plot the histogram of the percentiles of these students ability, it is very similar. So an Ivy league dude should have no right to feel any pride before those who go to State Universities.
To investigate further, let us consider other cutoffs. In Figure 2, the solid black line plots the percentage of students among admitted whose ability are in the top 1% of the population (refereed to as "the percentage" afterwards). As we can see, as cutoff increases, the percentage increases. As a robustness check, I have varied the weight of the ability in the score, namely $\sigma$. The pattern we see is robust to this change. Further, we see that when cutoff is low, increasing the weight of ability is not useful. But when the cutoff is higher, increasing the weight increases the percentage even further. When we make a test easy, the less informative the test becomes, the less efficient the matching algorithm.

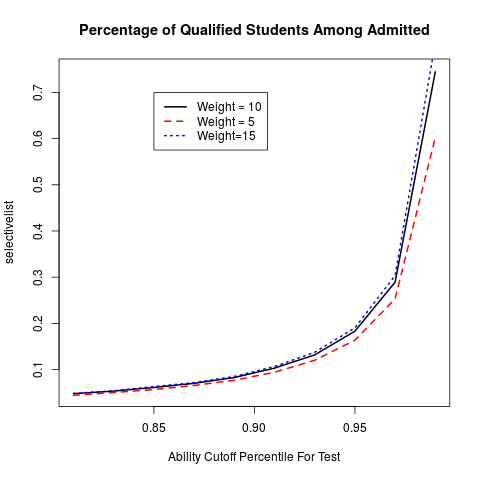
This paints a more optimistic picture then it really is. It seems easy simply to increase the cutoff by making the test harder. However, if we instead plot the percentage against the percentile of the cutoff (for example, if your ability is above 95% of that of the population, any increase in ability no longer helps the test score), we see a different picture.
Conclusion and Discussion
What we can conclude is that when ability is censored in the test, or more generally, when there is diminishing returns to ability in terms of test score, elite colleges, medical schools or elite employers are not as selective as they claim to be. The population admitted to elite institutions and "good institutions" differ more in their luck than abilities.Is this an simplification of matching process. For sure yes. There are usually multiple signals to be sent---if you are truly the top 0.01%, you can win some competition. Some might argue that the college admission in elite schools are "holistic". I do not entertain such Bullshit. This so-called holistic evaluation has racist origin, and is practised today with dishonesty and arrogance. Who are the admission officers to make judgement about an applicant's insight, or character, not to mention whether that student is a good match for the school, when at elite universities, many admission officers would not have been admitted themselves. No matter what, in each group of students who are comparable on other dimensions (race, legacy status, and perceived "character"), they will need to be sorted on academics terms and admitted. They undergo the same process I modelled. The inefficiency now shows up in each such group/stratum. The holitic admission additionally introduce more inefficiency.
Appendix: R code used
#set up
n <-10^6; #number of simulations
Traw <- rnorm(n,0,1) #simulate raw talent, will vary scaling
error <- rnorm(n,0,1) #simulate error term, variance normalized to 1
testcutoff <- 1
Btestcutoff <-Traw>=testcutoff #binary whether talent was cutoff for test
WTraw <-10 #weight of talent
score <- WTraw*(Traw*(1-Btestcutoff)+Btestcutoff*testcutoff)+error
admitcutoff <-quantile(score,0.99)
Badmitted <- score >=admitcutoff
TofAdmitted <- Traw[Badmitted]
percentileadmit <-pnorm(TofAdmitted)
png("Histogramofpercentile.png")
hist(percentileadmit,probability=TRUE,breaks=seq(from=0.7,to=1,by=0.02),main="Histogram of Ability Percentile Among Admitted",xlab="Ability Percentile")
dev.off()
mean(percentileadmit>0.99)
stateschool <- (score <=quantile(score,0.91)) &(score> quantile(score,0.9))
stateschool <-Traw[stateschool]
statepercentileadmit <-pnorm(stateschool)
hist(statepercentileadmit,probability=TRUE,breaks=seq(from=0.7,to=1,by=0.02),main="Histogram of Ability Percentile Among Admitted",xlab="Ability Percentile")
mean(statepercentileadmit>=0.99)
#func
tion
trueselective <- function(testcutoff, WTraw, selectivelevel){
Btestcutoff <-Traw>=testcutoff #binary whether talent was cutoff for test
score <- WTraw*(Traw*(1-Btestcutoff)+Btestcutoff*testcutoff)+error
admitcutoff <-quantile(score,0.99)
Badmitted <- score >=admitcutoff
TofAdmitted <- Traw[Badmitted]
percentileadmit <-pnorm(TofAdmitted)
return(mean(percentileadmit>selectivelevel))
}
# Plot 2---selective level at different cutoff
cutofflist <- seq(1,3,0.1)
selectivelist <- lapply(cutofflist,trueselective,WTraw=10,selectivelevel=0.99)
selectivelist2 <- lapply(cutofflist,trueselective,WTraw=5,selectivelevel=0.99)
selectivelist3 <-lapply(cutofflist,trueselective,WTraw=15,selectivelevel=0.99)
png("selectivecutoff.png")
plot(cutofflist,selectivelist,lwd=2,lty="solid",type="l",main="Percentage of Qualified Students Among Admitted",xlab="Ability Cutoff Level For Test")
lines(cutofflist,selectivelist2,lty="dashed",col="red",lwd=2)
lines(cutofflist,selectivelist3,lty="dotted",col="blue",lwd=2)
legend(1,0.8,c("Weight = 10","Weight = 5","Weight=15"),lty=c("solid","dashed","dotted"),col=c("black","red","blue"),lwd=2)
dev.off()
# Plot 3---selective level at different cutoff percentile
cutoffpercentilelist <- seq(0.81,0.99,0.02)
implicitcutofflist <- qnorm(cutoffpercentilelist)
selectivelist <- lapply(implicitcutofflist,trueselective,WTraw=10,selectivelevel=0.99)
selectivelist2 <- lapply(implicitcutofflist,trueselective,WTraw=5,selectivelevel=0.99)
selectivelist3 <- lapply(implicitcutofflist,trueselective,WTraw=15,selectivelevel=0.99)
png("selectiveatcutoffpercentile.png")
plot(cutoffpercentilelist,selectivelist,lwd=2,lty="solid",type="l",main="Percentage of Qualified Students Among Admitted",xlab="Ability Cutoff Percentile For Test")
lines(cutoffpercentilelist,selectivelist2,lty="dashed",col="red",lwd=2)
lines(cutoffpercentilelist,selectivelist3,lty="dotted",col="blue",lwd=2)
legend(0.85,0.7,c("Weight = 10","Weight = 5","Weight=15"),lty=c("solid","dashed","dotted"),col=c("black","red","blue"),lwd=2)
dev.off()
Very interesting article. It's consistent with our intuition that a test sometimes fails in screening out the most elitist candidates. However, one problem is tests favors those with intellectual advantages who sometimes are not necessarily the best students/employees.
ReplyDeleteSecondly ,to me, most times tests/scores serves as negative selection mechanism, meaning that it does not pick out the most outstanding kids rather that screening out the inadequate candidates. I wonder the histogram of ability of the rejected will be like.
Another question is whether it's the elite colleges' intention to pick out the most brilliant kids and create a intellectual utopia.
Just a few random thoughts, I'm your old high school classmate Siyuan Xu. I'm very glad to run into your blog and catch up with you. Ciao.